Civil engineering · UT Austin · Consulting & risk management

Born in Humble.Raised in Borneo.Schooled in Qatar.Building in Austin.

I’m Pedro Guzman, a civil engineering student at UT Austin looking for consulting work in energy, infrastructure and risk. I grew up inside that industry, in the expatriate compounds where it operates, and for the last two years I’ve been doing the work rather than waiting for it: building teams, running risk models and grid simulations, planning sites, and bringing in the clients who pay for them.

I’m Pedro Guzman, a civil engineering student at UT Austin looking for consulting work in energy, infrastructure and risk. For the last two years I’ve been doing the work rather than waiting for it: building teams, running risk models and grid simulations, planning sites, and bringing in the clients who pay for them.

ScrollAustin, TX · Civil Engineering, UT Austin
Nº 01The journey

Four places. One industry.

Most people meet this industry through a job posting. I met it through neighbors, classmates, and dinner guests, in four countries where it was the reason anyone was there at all.

01

Humble, Texas

The start

The town an oil company took its name from

I was born in Humble, Texas, the town Humble Oil took its name from before it grew into Exxon. I was gone before I could remember it, but the pattern was set: wherever my family went, energy and infrastructure had gotten there first.

02

Borneo

Childhood

Raised on an island of engineers

I grew up in Panaga, the Brunei Shell housing area on the coast of Borneo. House F23. Compounds mix everyone together: drillers, geologists, project managers, and their families from every part of the world, living a few minutes from the offices they worked in. I met the industry at the dinner table years before I studied it, and the people at that table were the ones running it.

03

Doha, Qatar

High school

High school in a city being built

I spent my high school years in Doha. Between arriving and leaving I watched a skyline appear, seven World Cup stadiums go up from nothing, and The Pearl rise on ground reclaimed from the Gulf. Living inside a construction boom taught me that infrastructure doesn’t simply appear, it gets decided, financed, and delivered by people, and I wanted to be one of them.

04

Austin, Texas

Now

Home, with the industry in view

I came home to study civil engineering at UT Austin, but the side that pulled me in was the client side: scoping the work, selling it, and being accountable for it. Within a year I had founded a student consultancy and joined Zornberg’s geotechnical lab. Since then it’s been interdisciplinary teams that outlast me, projects across two continents, and tools built because nothing off the shelf did the job. I’m not at that table anymore. I built one of my own and put a hundred people around it.

Nº 02Impact

The numbers behind the story

Real clients, real budgets, real teams. Every figure here came from a project with a client on the other end of it.

10+

Clients served

Boards, agencies, labs, and residential clients across four industries

$210M

Project scope directed, scoped, or master-planned

$185M master planning with Regis Energy, $25M scoped through the organization I founded

100+

Students engaged

Multi-disciplinary teams across five universities

3+

Sponsored research projects

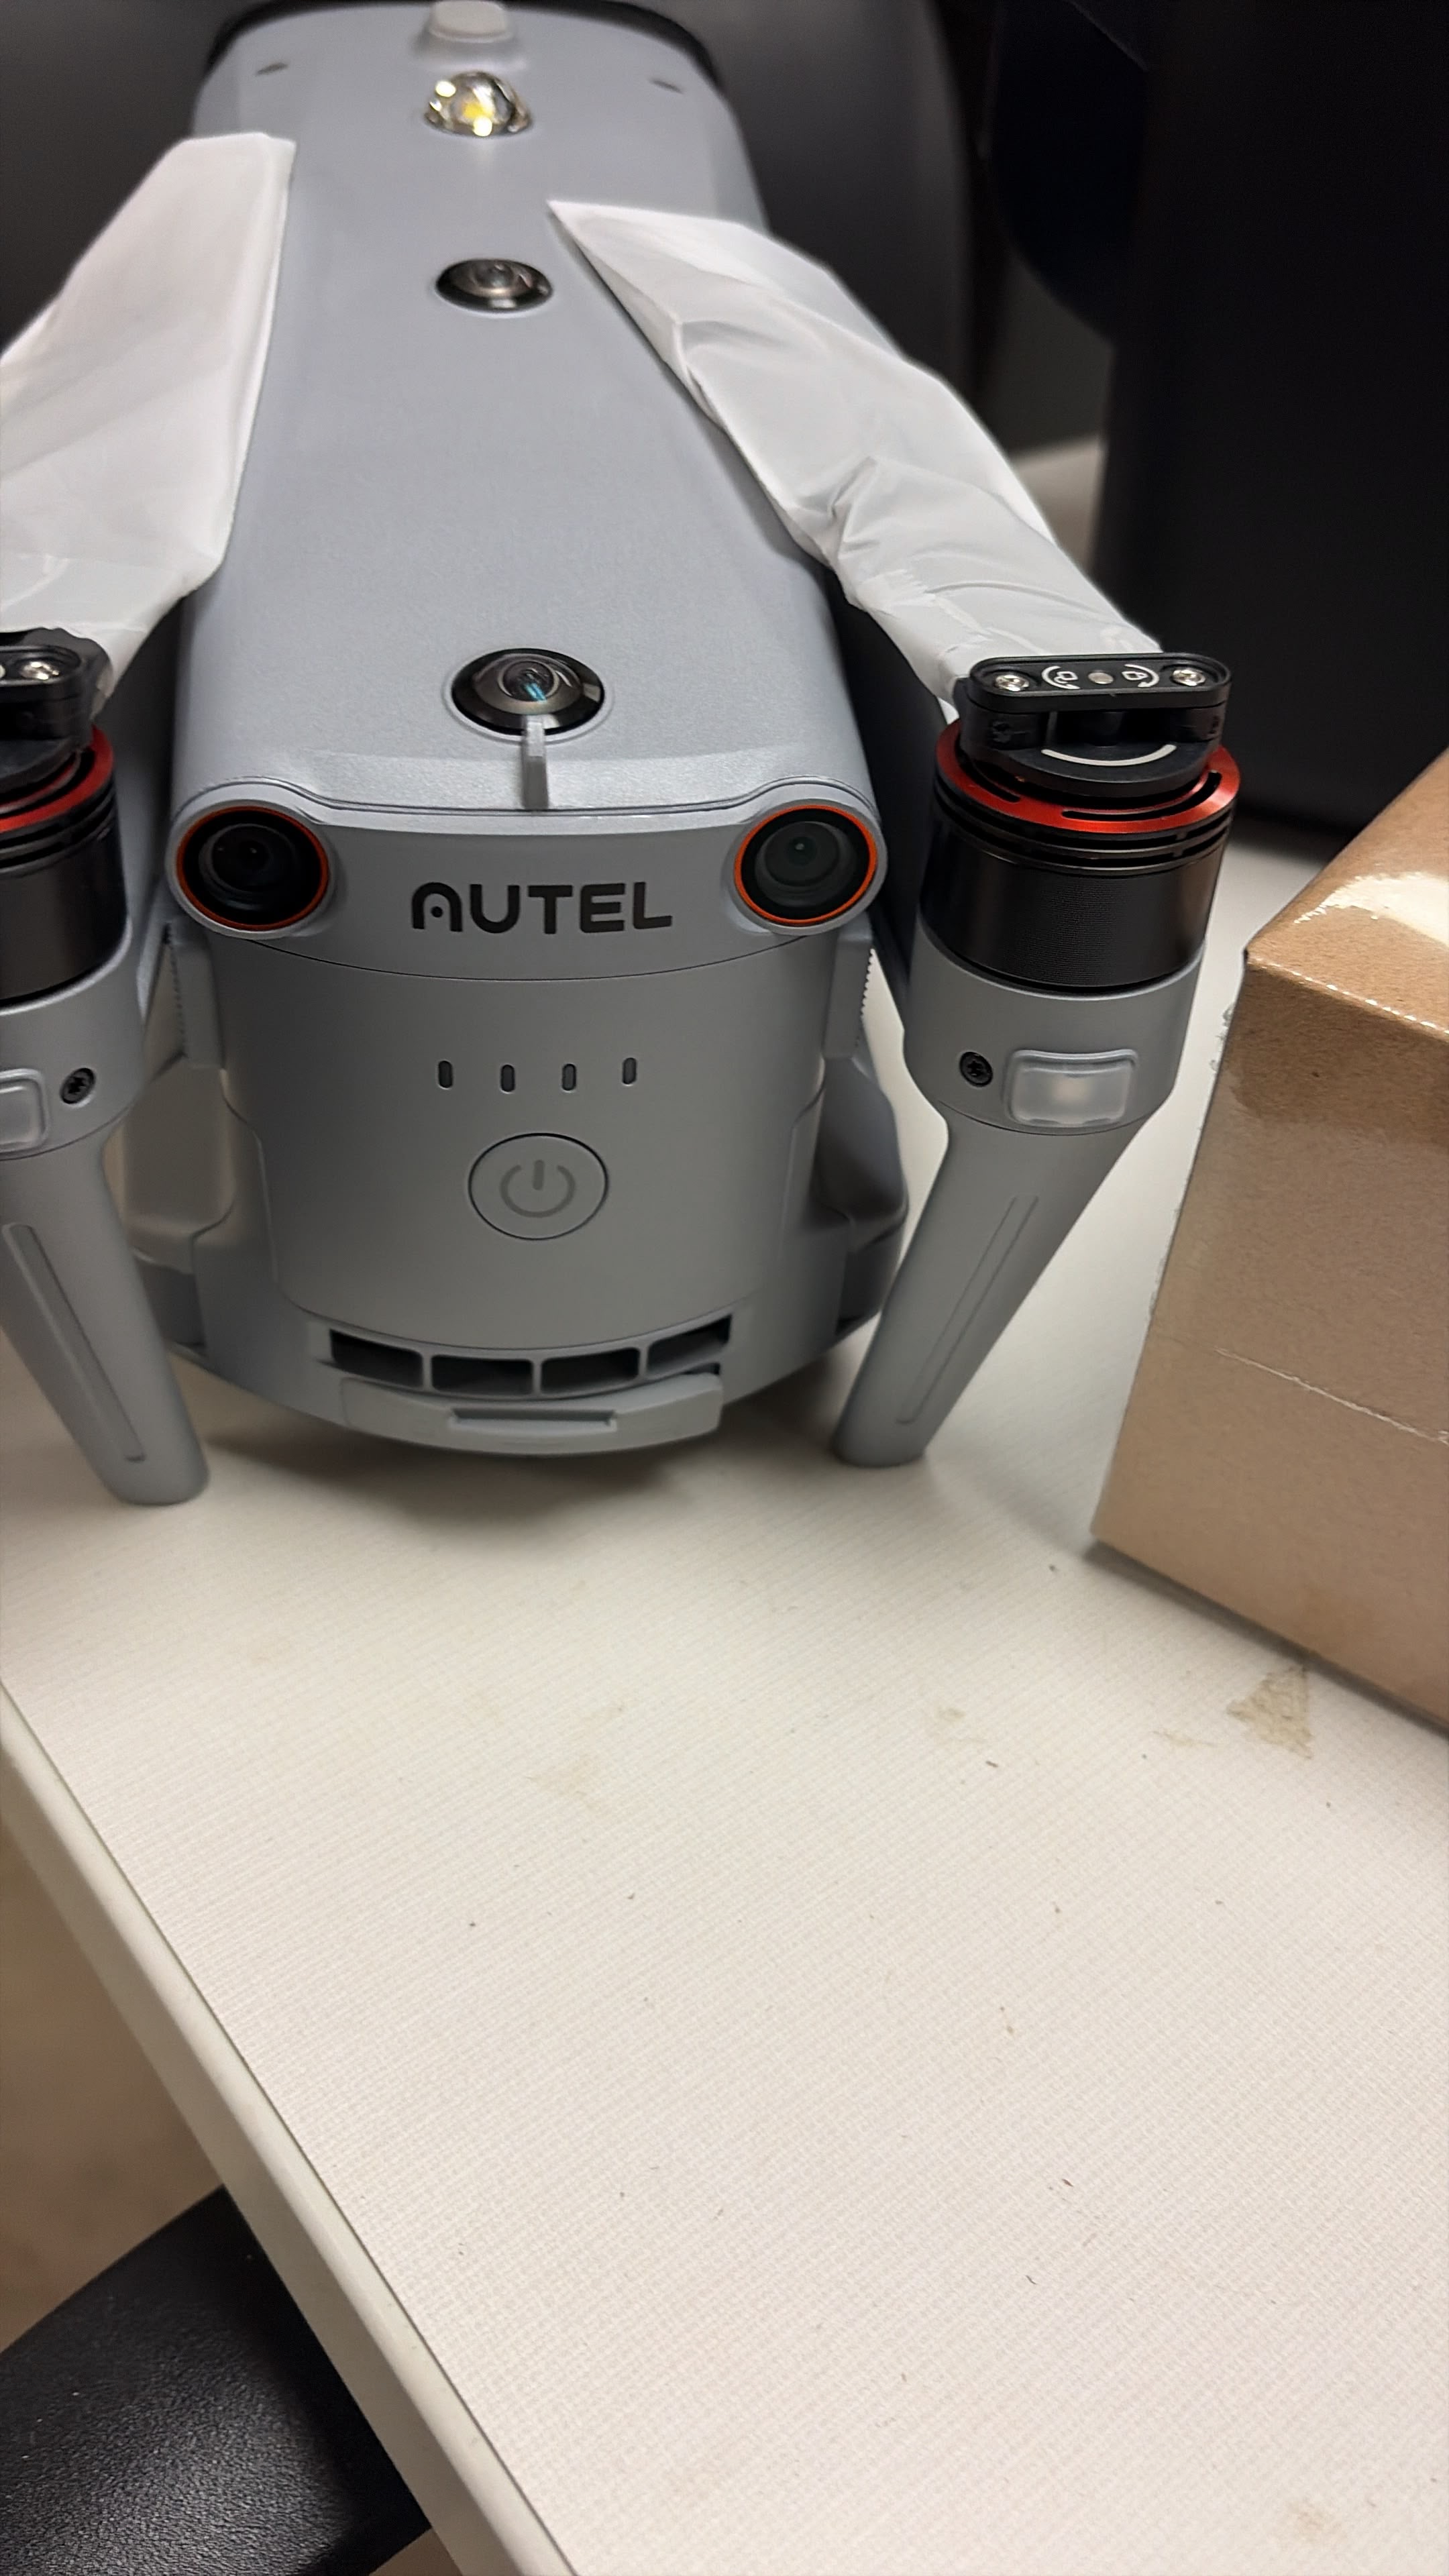
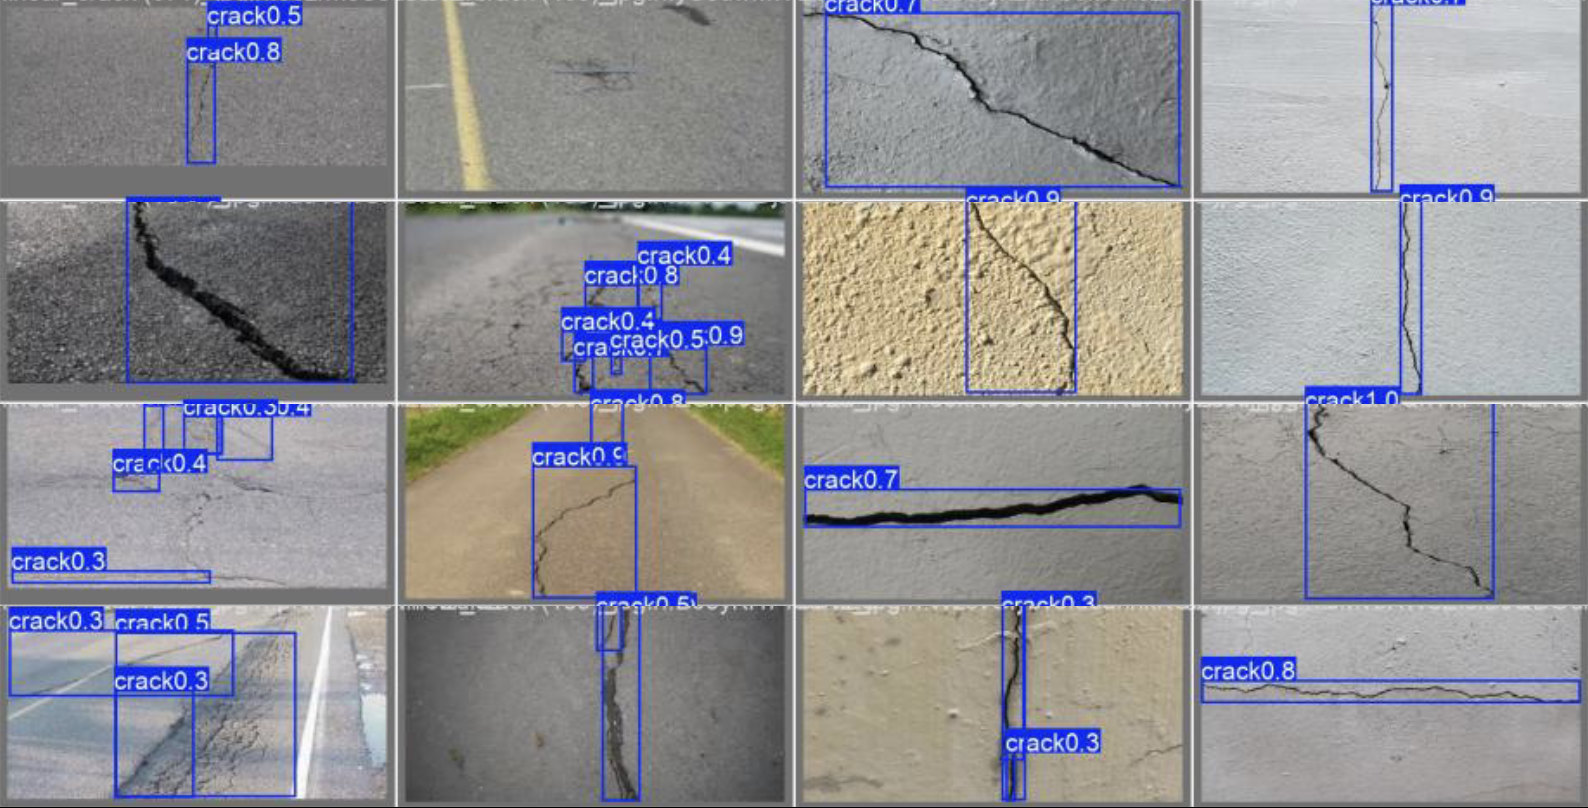
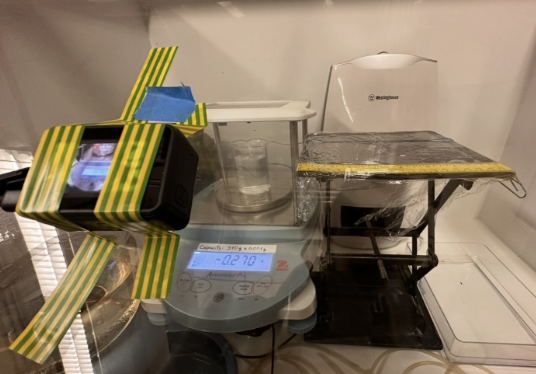
Geosynthetics, UAV imaging, and national grid modeling

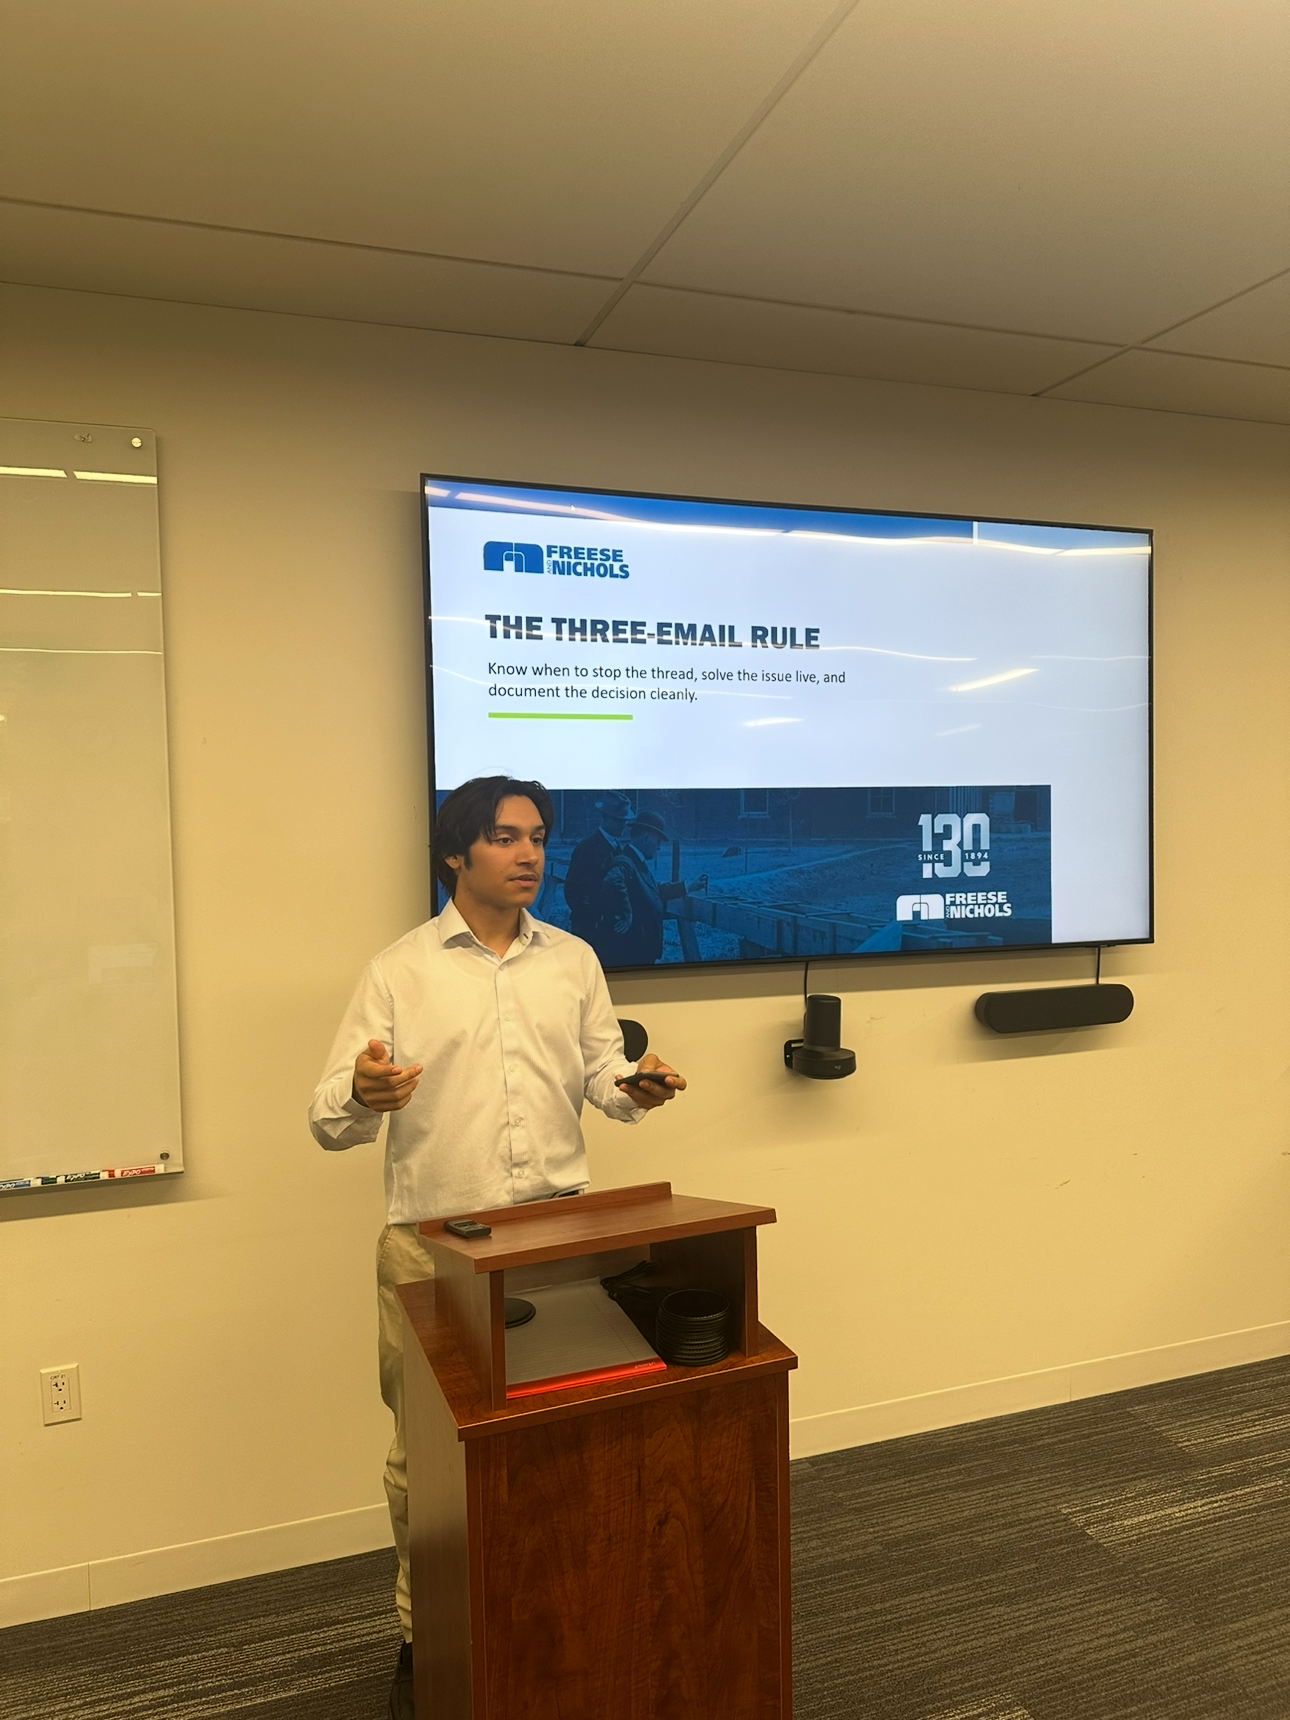
Freese & NicholsRegis EnergyICELIS GlobalUT AustinZornberg LabUniversity of IbadanUN Forum on Business and Human Rights (Nov 2026)TCEQASCESustainable Building InitiativeTexas A&MRicePurdueImperial College LondonFreese & NicholsRegis EnergyICELIS GlobalUT AustinZornberg LabUniversity of IbadanUN Forum on Business and Human Rights (Nov 2026)TCEQASCESustainable Building InitiativeTexas A&MRicePurdueImperial College London
Nº 03The work

Eleven projects, told properly.

What I built, who it was for, and what changed because of it. Open any study for the full story. Three of them ship with the actual tools, and the three marked Key project are the ones I would open first.

11Gulf Coast Energy Book: Market & Credit Risk SystemIndependent project · Built, validated, and shipped solo · Sep 2026Risk modelingSoftware

The report a Commodity Risk team publishes every morning, built end to end and published live

A Commodity Risk team sits between the trading desk and management. Every morning it publishes an independent report that says what the book is exposed to, what it could lose, whether it is inside its limits, whether the model has been proven trustworthy, and who owes the firm money. Independent is the operative word: nothing is taken from the trader. Prices come from public EIA and FRED files, positions and limits from a controlled file, and every number below is recomputed on each run. I built that report for a fictional four-position Gulf Coast book (long WTI, short Brent, long Henry Hub gas, long Gulf Coast gasoline) on 2,943 market days from January 2015 to September 2026. The page below is the report itself: pick any date, switch the VaR method or confidence, and hover any number to see the table and formula it came from.

The Daily Risk Report, live. Six pages, a date selector across 2,943 market days, method and confidence slicers, and a tooltip on every visual naming its source table and measure. Best viewed full screen.Open full screen ↗

Behind the page is one command. Raw price files go through curve-validation checks (missing, stale, outlier, negative and unit-sanity, each finding reviewed and logged), mark-to-market P&L with an attribution that explains every day to the cent, Value at Risk by historical simulation, parametric, EWMA and Monte Carlo methods with Expected Shortfall on a rolling 250-day window, a backtest with Kupiec and Christoffersen tests, six historical crisis replays and five hypothetical shocks, a limits framework with a breach log and an escalation memo, a counterparty credit module with letters of credit, netting, potential future exposure and wrong-way risk, and out the other end come twenty SQLite tables, the CSV exports a Power BI report reads, and the six pages above. An Excel workbook reproduces one day of it with spreadsheet formulas, to the cent.

What the report shows, in four screenshots

01

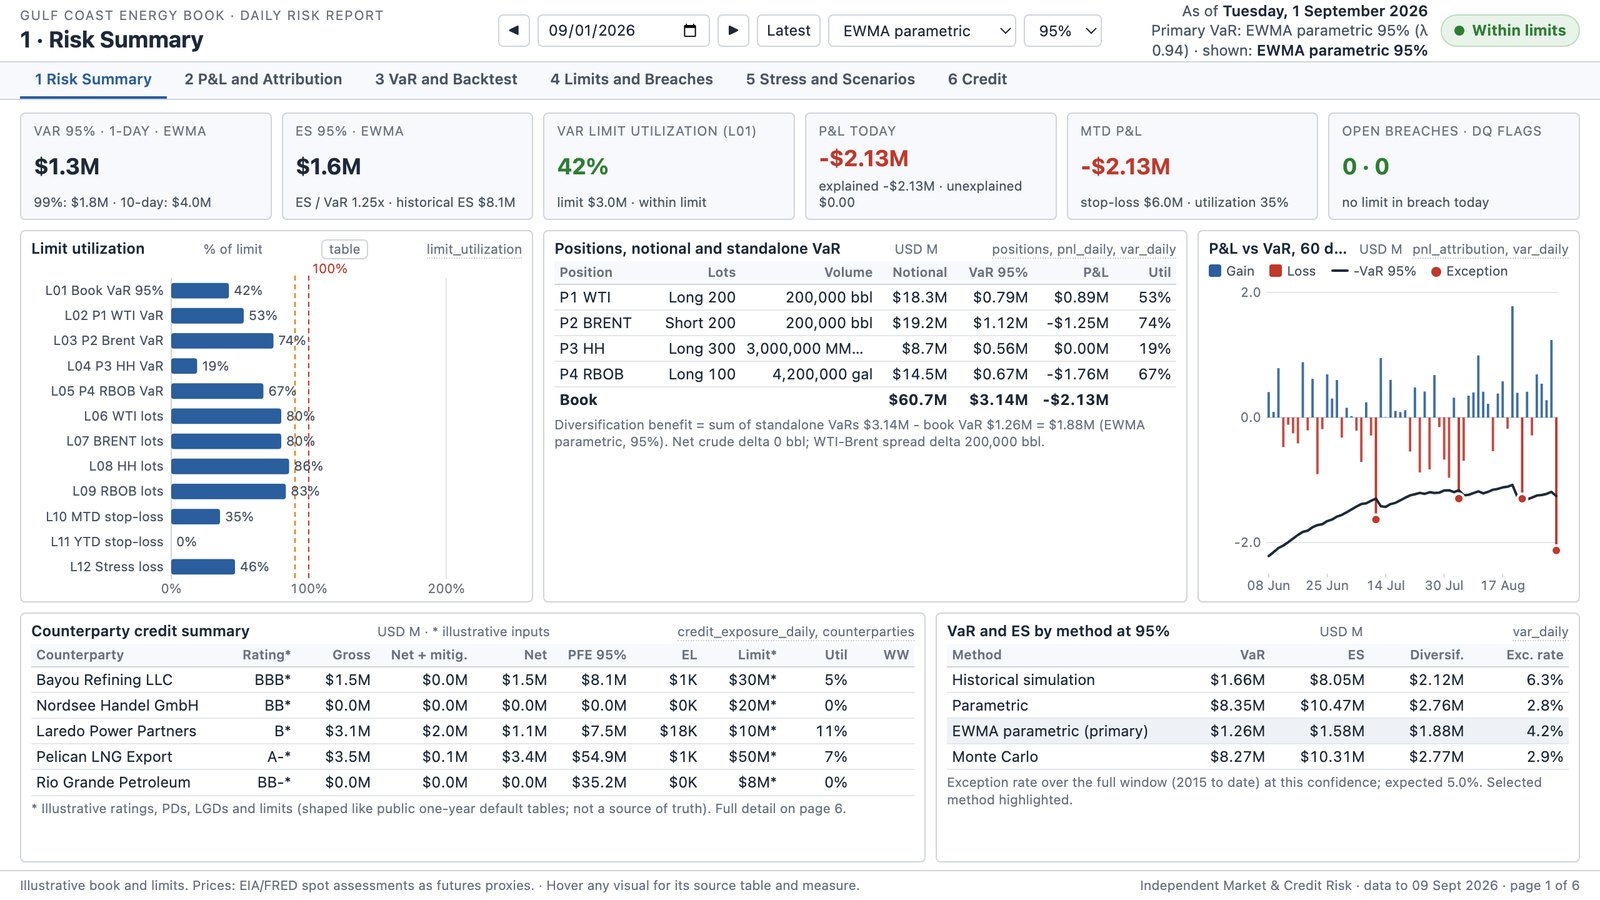
A normal morning. The latest date: within limits, book VaR at 45% of its limit, every number with a unit and a sign, every visual naming the table it reads from. This is the page a desk head reads with coffee, and the one a Commodity Risk hiring manager should recognise.

Daily Risk Report page 1, Risk Summary, on a calm day: market risk cards for VaR, Expected Shortfall and limit utilization, a positions table, P&L against VaR, and a credit summary, all within limits
Risk Summary, 9 September 2026. Market risk, credit risk and financial controls on one page, within limits.
02

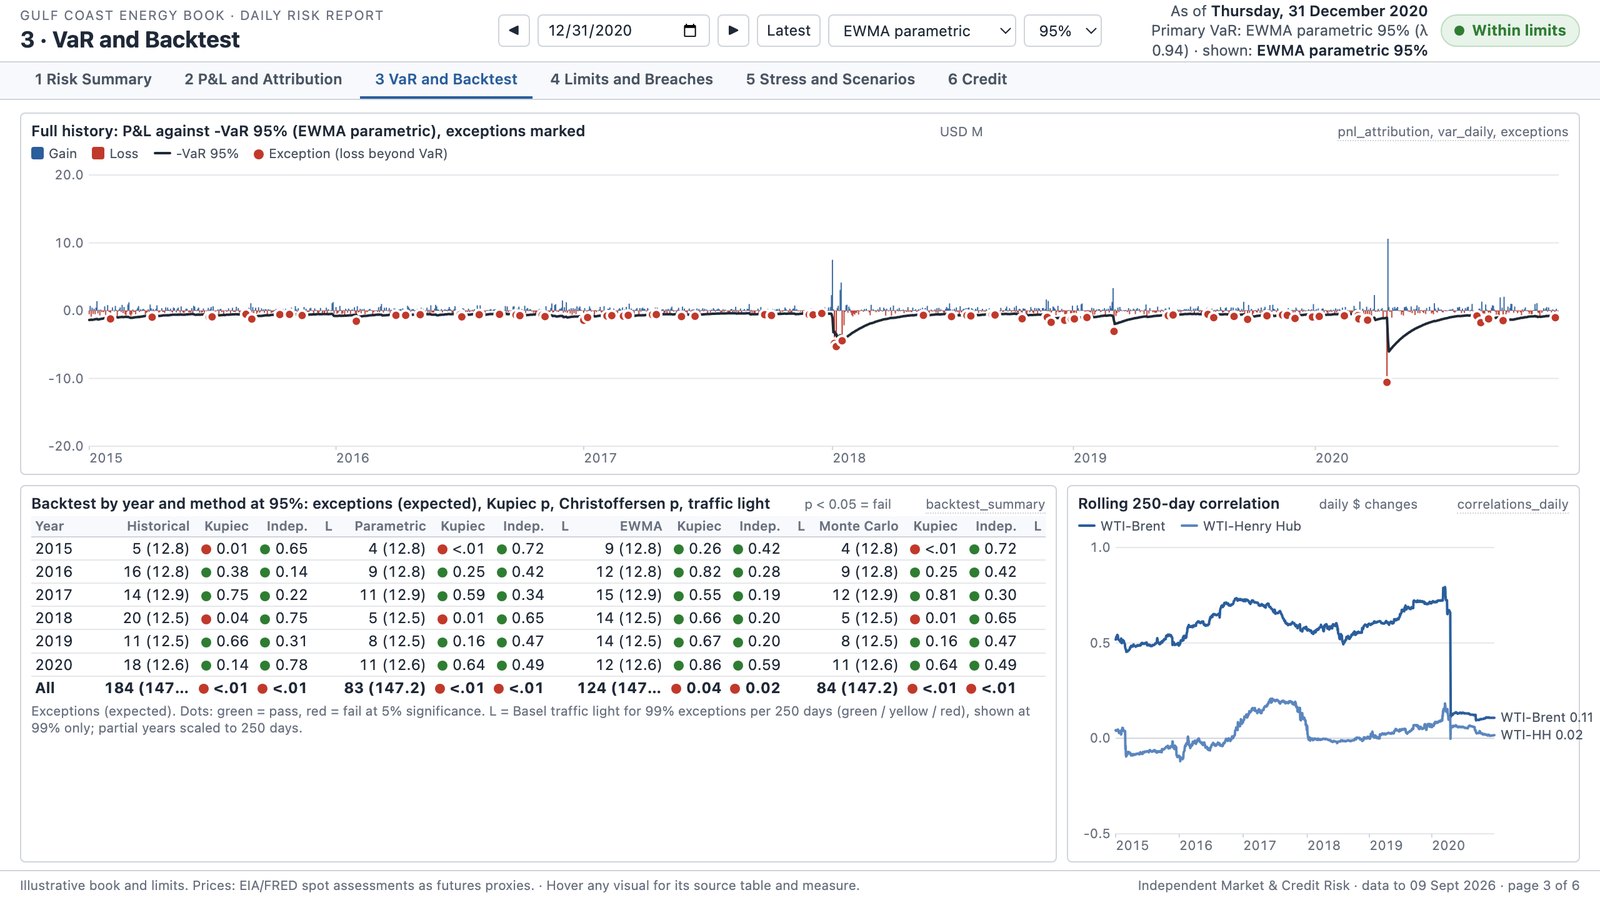
The hedge failed on 20 April 2020. WTI printed -$36.98 while Brent fell $2.39, so the long-WTI, short-Brent spread leg lost $10.6M in a day against a VaR of about $1.0M. On the backtest page the day shows as a red exception on the 2020 chart, and the attribution explains it to the cent: all spread, no outright crude.

Daily Risk Report page 3, VaR and Backtest, as of 31 December 2020: daily P&L against the VaR band with red exception markers, the Kupiec and Christoffersen matrix by year and method, and rolling correlations
VaR and Backtest as of 31 December 2020. Exceptions marked in red; Kupiec and Christoffersen results by year and method.
03

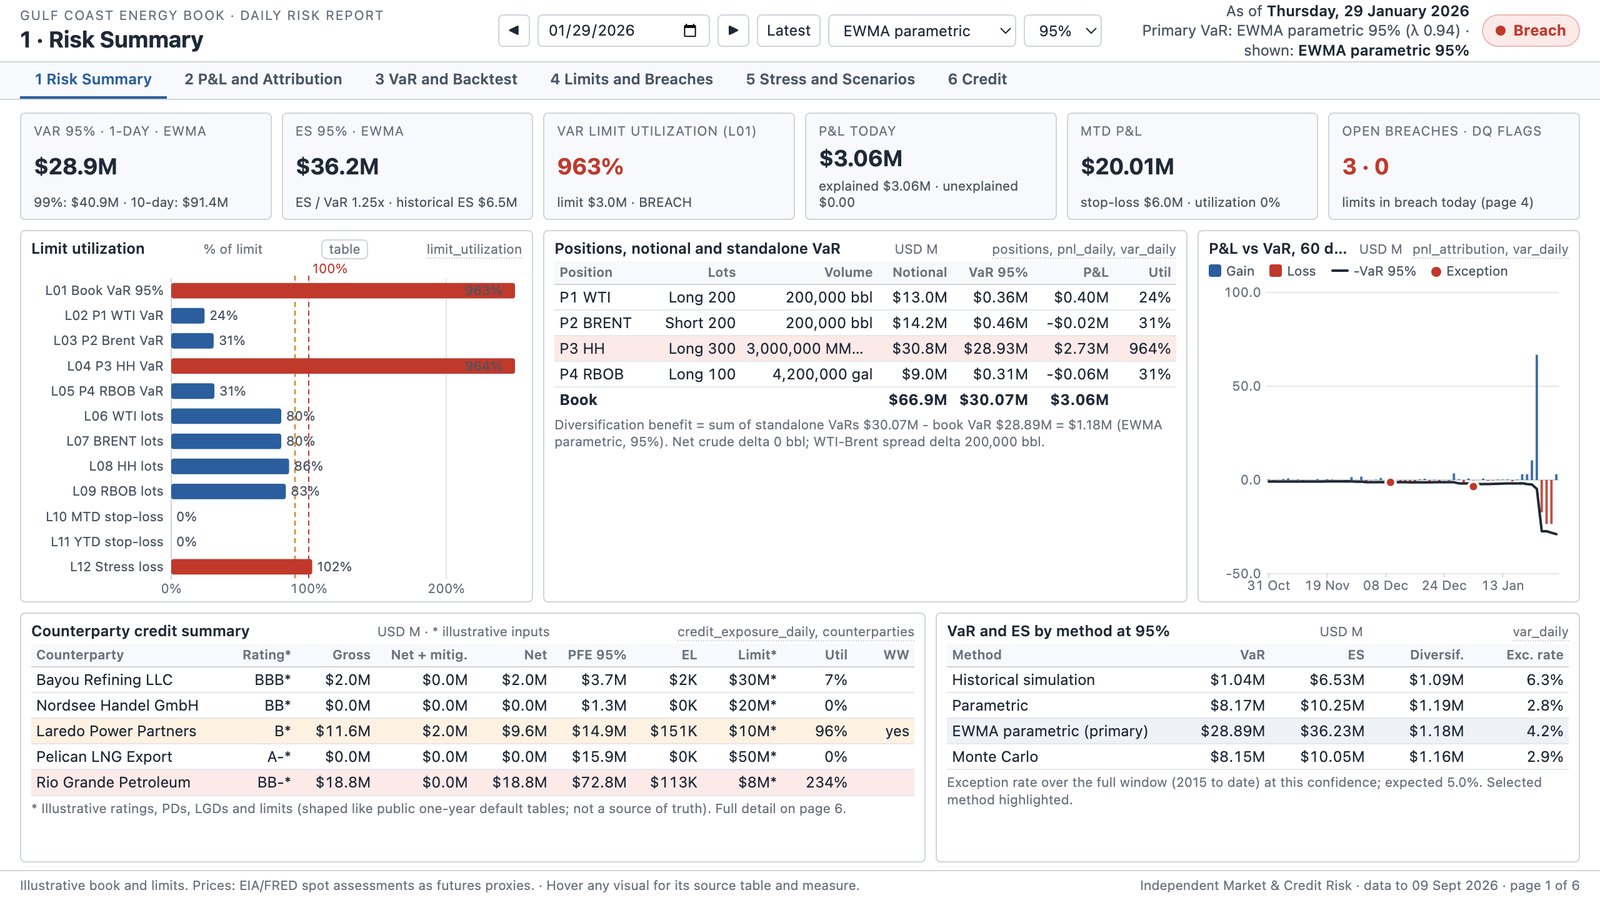
Only one method survives the backtest, and it is the one that reacts. No method passes coverage at 95% over the full window; EWMA comes closest at 4.2% and is the only one that passes the independence test in every year. On the largest breach day, 29 January 2026, its VaR had already jumped to $28.9M while the 250-day historical figure was still $1.0M. EWMA runs the limits, cross-checked against historical Expected Shortfall for the tail.

Daily Risk Report page 1 on 29 January 2026, the largest breach in the history: a red Breach status pill, VaR limit utilization at 963%, three limits in breach and the Henry Hub position highlighted
Risk Summary, 29 January 2026: three limits in breach after Henry Hub printed $30.72. The escalation memo for this day is in the repository.
04

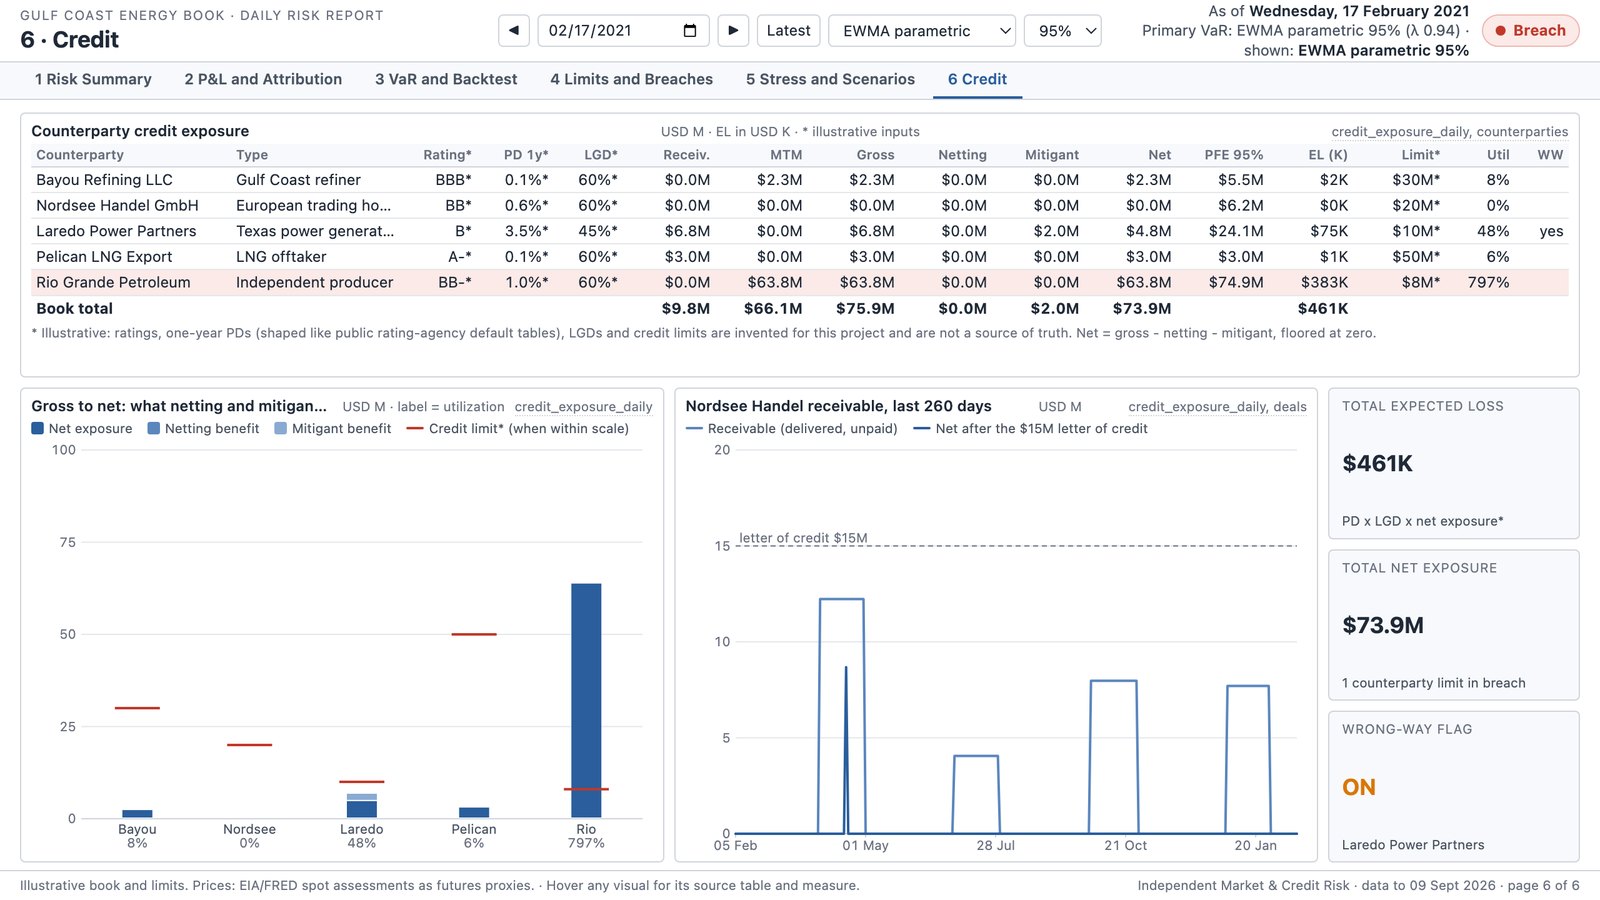
Stress and credit say VaR is not the whole story. The Winter Storm Uri replay is a $61.7M loss, 45 times the current one-day VaR. On the Uri peak the credit page shows the generator’s index-priced gas bill rising exactly when a weak generator is likeliest to fail (wrong-way risk), the letter of credit netting the cargo receivable, and the producer’s forward gas deal carrying $64M of replacement cost against an $8M limit.

Daily Risk Report page 6, Credit, on 17 February 2021, the Winter Storm Uri peak: counterparty credit risk table with ratings, PFE, expected loss and limit utilization, gross-to-net exposure bars, the receivable timeline, and the wrong-way flag on
Credit, 17 February 2021, the Uri peak: counterparty credit risk with netting, mitigants, PFE and the wrong-way flag on.

How it was designed and shipped

  1. Scoped like a controls team.Four ground rules before any code: every number recomputed independently of the desk, every invented input labelled illustrative, every failure published, and AI used to accelerate the coding but never to explain it. The scope named the three readers (hiring manager, technical interviewer, recruiter) and each design decision was made for them.
  2. Data first.Four public series with a download manifest (URL, bytes, SHA-256), a market-calendar rule (a weekday with at least two prints), forward-fills that are flagged rather than silent, and five curve-validation checks whose 87 findings each carry a written review decision, including the negative WTI print and the Uri and January 2026 gas spikes.
  3. An engine that can be checked by hand.Dollar changes on fixed volume (the convention that survives a negative price), an attribution identity with a zero residual, three VaR methods plus EWMA and Expected Shortfall on a rolling window, and a fixed seed. An Excel workbook rebuilds one day with COVARIANCE.S, MMULT, NORM.S.INV and PERCENTILE.INC and matches Python to the cent.
  4. Validated before it was believed.Kupiec and Christoffersen by year and method, window sensitivity at 125, 250 and 500 days, Monte Carlo convergence to a million paths, twelve cross-checks that run at the end of every pipeline run, and a 25-test suite that corrupts prices and duplicates dates to prove the halts work. The validation report lists sixteen open issues.
  5. Measurement turned into control.Twelve limits calibrated after seeing the numbers so that breaches actually occur, a breach log with consecutive-day counts and escalation status, and a one-page escalation memo filled in for the January 2026 gas spike with options and a decision deadline. A credit module with rolling forward deals, netting, mitigants, PFE and wrong-way risk.
  6. Designed the display before building it.A written display specification fixed the canvas (1280 by 720), one blue for the book, red only for losses and breaches, amber only for warnings, green only for within limit, three type sizes, units and sign conventions on every number, a status pill driven by a measure, and a source table on every visual. Then the six pages were built as a static page from the same output tables, with the Power BI data model and DAX documented for the Windows port.
  7. Shipped as a pipeline, not a notebook.One command runs raw prices to finished report in about thirty seconds, re-runs identically, and refreshes this page and the PDF when a later end date is passed. Code, methodology, validation report, memo and specification are public on GitHub; the report you scrolled past is served from this site with its data file.

2,943

Market days backtested

6

Report pages, 40+ traceable visuals

12 / 12

Independent cross-checks passing

Tools

  • EnginePython (pandas, numpy, scipy, matplotlib), one command from raw prices to report
  • DatabaseSQLite, 20 tables, saved SQL queries, CSV exports for Power BI
  • Hand-checkExcel with COVARIANCE.S, MMULT, NORM.S.INV and PERCENTILE.INC, matching Python to the cent
  • Reportsix pages as a live web page (vanilla JS and SVG, no libraries) and as PDF; Power BI model and DAX specified
  • AIused to accelerate the coding; every formula, parameter and control verified independently
Nº 04The takeaway

What I bring to a consulting team

I grew up moving with this industry and came back to Texas to build things here. In two years that has materialized as an organization that outlasts my involvement in it, teams at five universities, and projects with real clients, real budgets, and real deadlines.

What I’m good at is the part between the engineering and the client: taking a problem that arrives without shape and giving it one, building the analysis that settles it, leading teams across disciplines, and telling a client what that analysis actually supports rather than what they hoped it would. My research publishes its own failures. My projects name the constraint that’s binding. That’s the habit I’d bring to your firm.

I turn technical questions into decisions a team can act on, and I want to do that in the industry I grew up in.

  • 01Teams built and kept: five universities, 90+ members
  • 02Delivered under constraint: $800K shipped, $185M scoped
  • 03Client-facing since 18: scoped and sold work to public agency boards
  • 04I state what the analysis supports, and what it doesn’t
Nº 05Contact

Let’s talk.

If any of this maps to a problem you’re working on, I’d like to hear about it.

Based in
Austin, TX